Most people think “safe” means keeping money in a savings account.
But safe is not always as safe as it feels.
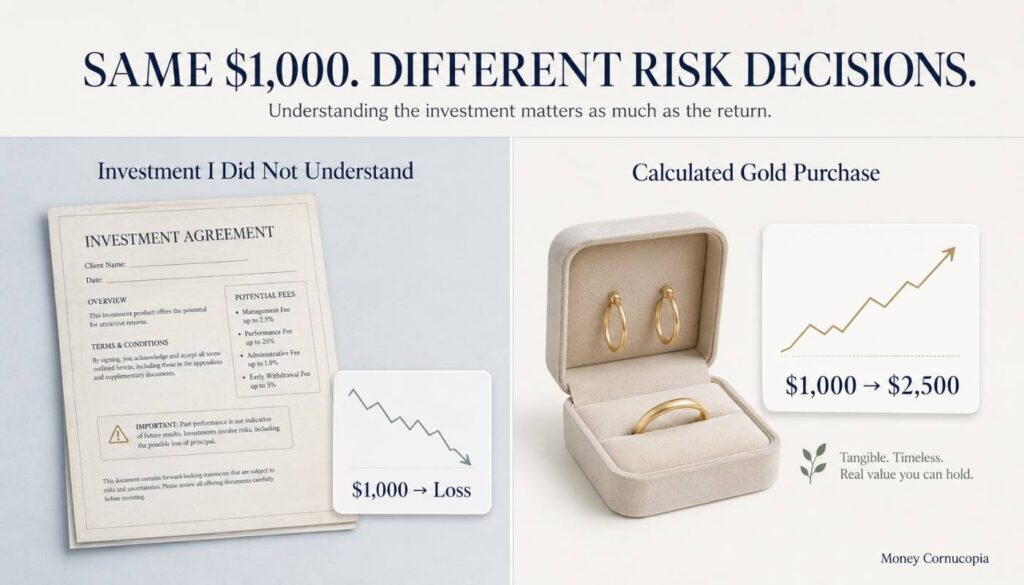
A few years ago, I lost roughly $1,000 on an insurance investment I did not fully understand. Around the same period, I put a little over $1,000 into gold jewelry, and that gold later became worth roughly $2,500.
Same person. Similar amount of money. Two completely different outcomes.
That is the risk-return tradeoff in real life.
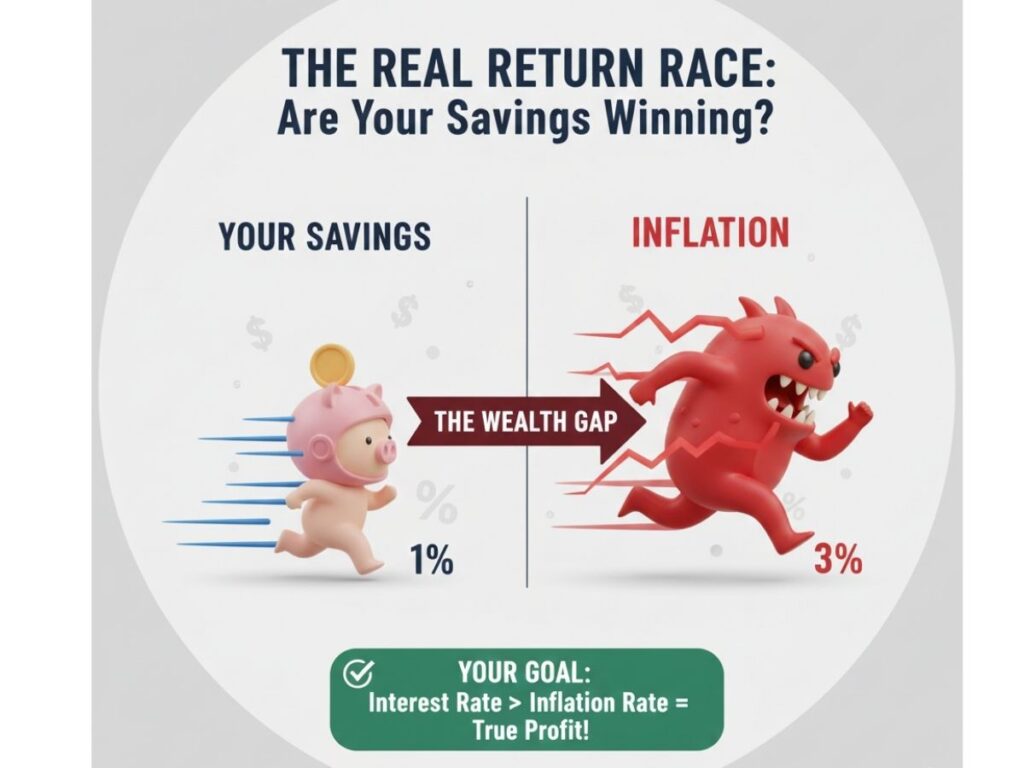
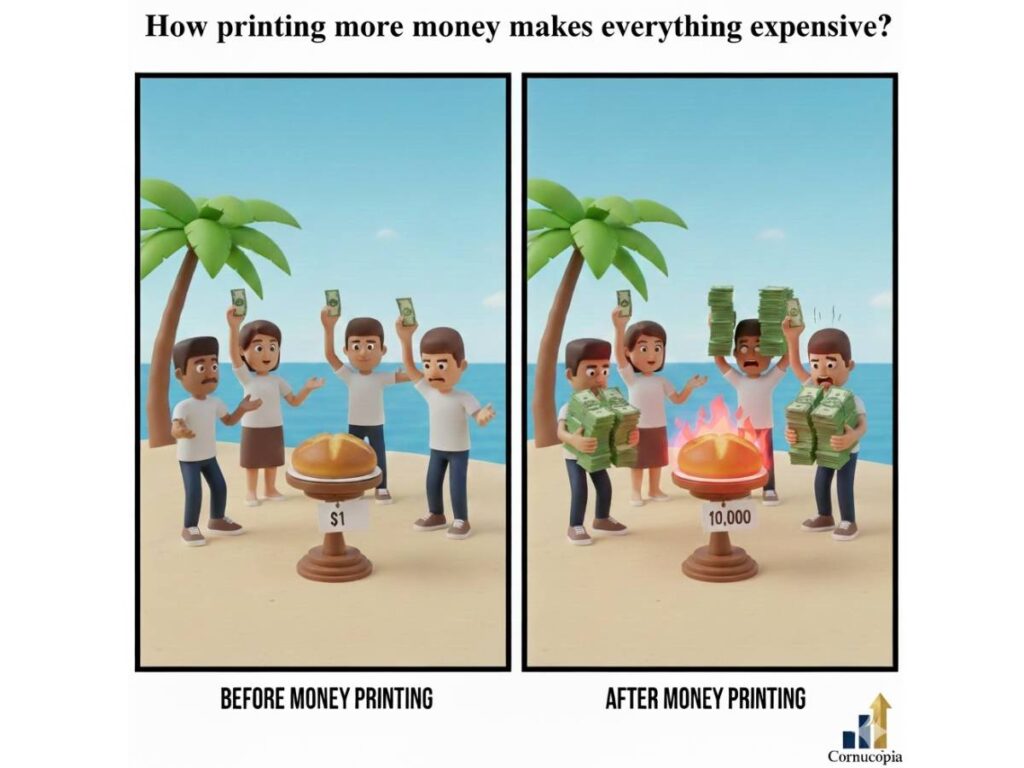
It means the chance of higher returns usually comes with a higher chance of loss. Keep your money too safe, and inflation can quietly eat away at it. Chase returns without understanding the risk, and you can lose money faster than you expected.
This article explains the risk-return tradeoff in plain language using real beginner-friendly examples instead of textbook theory. By the end, you will understand how risk and return work, why “safe” choices can still carry hidden costs, and how to choose a level of risk that actually fits your money, timeline, and personality.
Table of Contents
What the Risk Return Tradeoff Actually Means
In simple terms, the risk return tradeoff means you usually cannot earn high investment returns without accepting the possibility of bigger losses along the way.
Every investment is a bet. The risk-return tradeoff is the size of the bet versus the size of the potential prize.
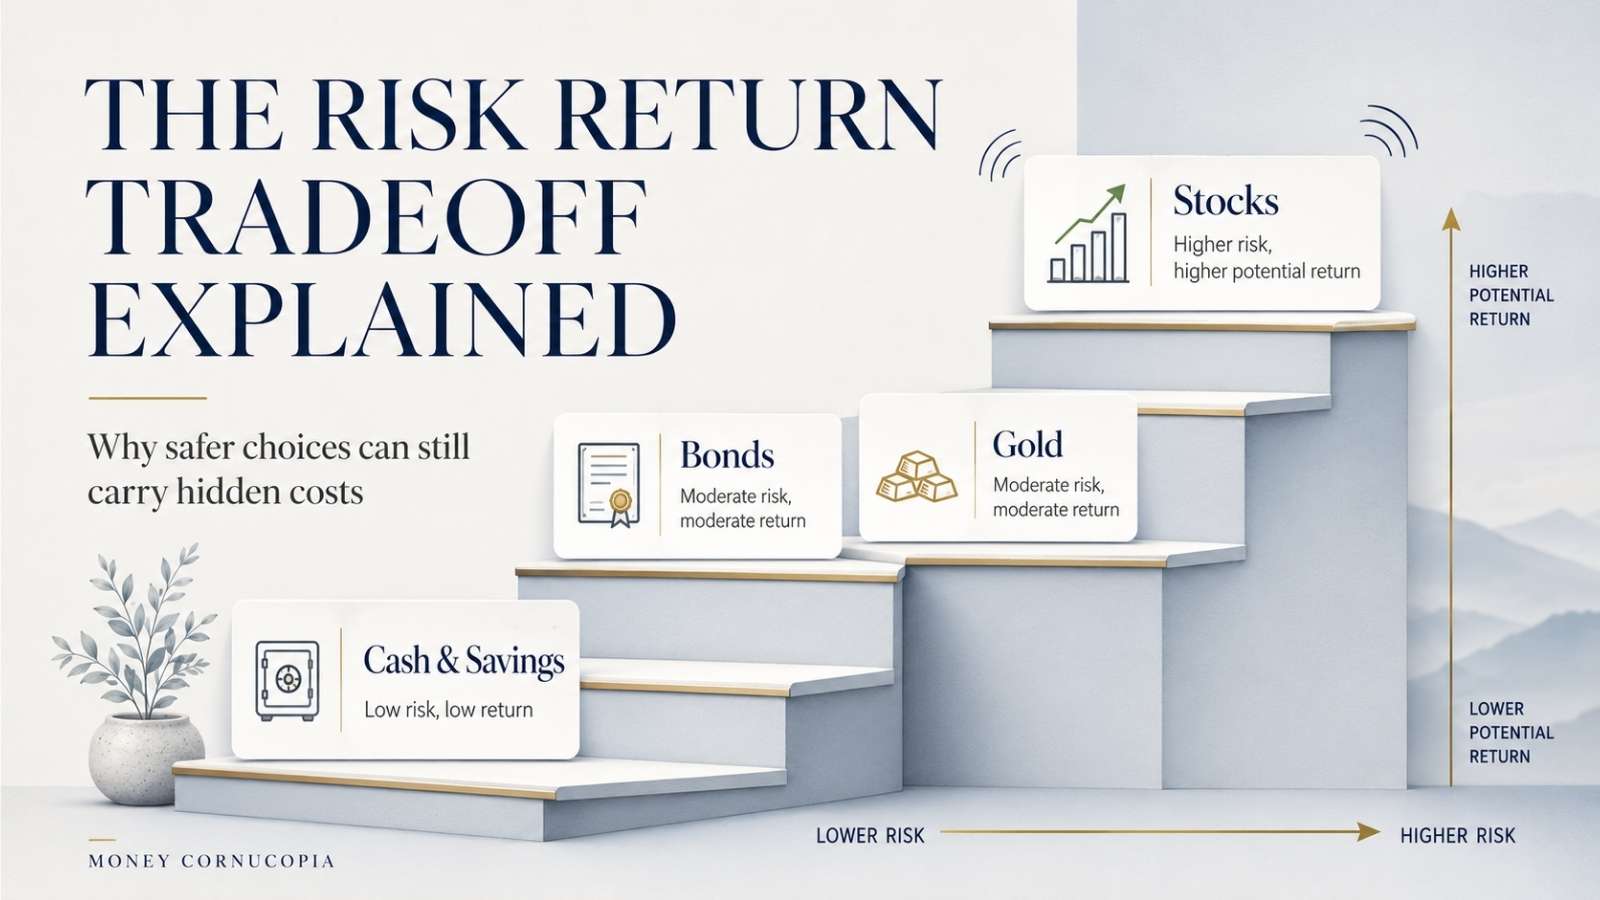
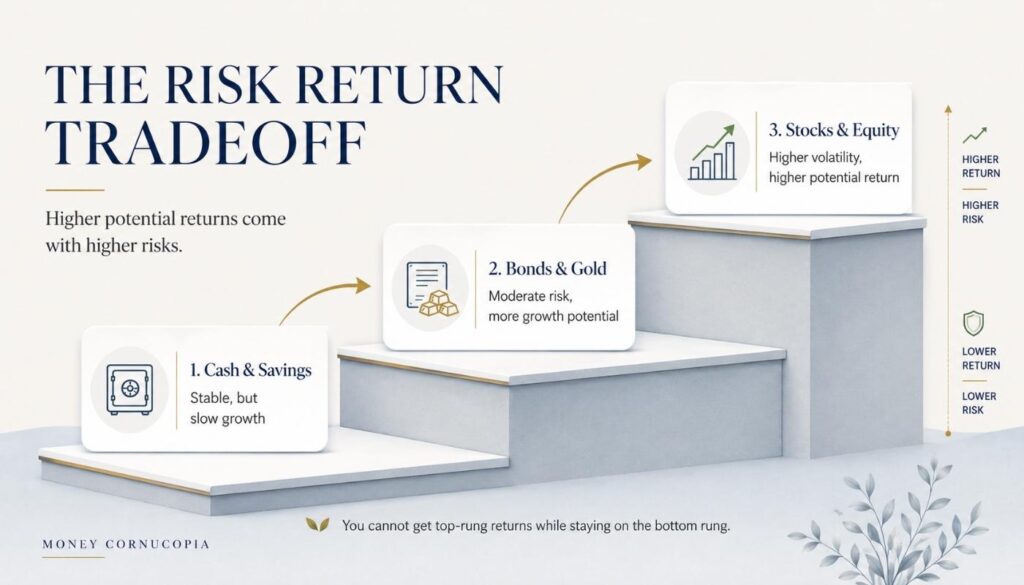
Think of your money on a ladder. The higher you climb, the better the view, but the more the ladder shakes.
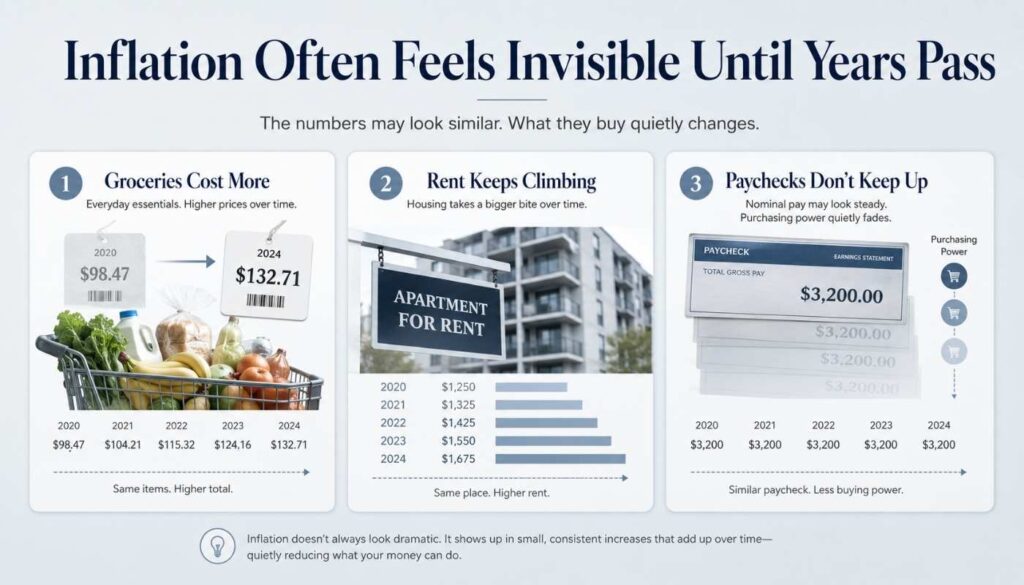
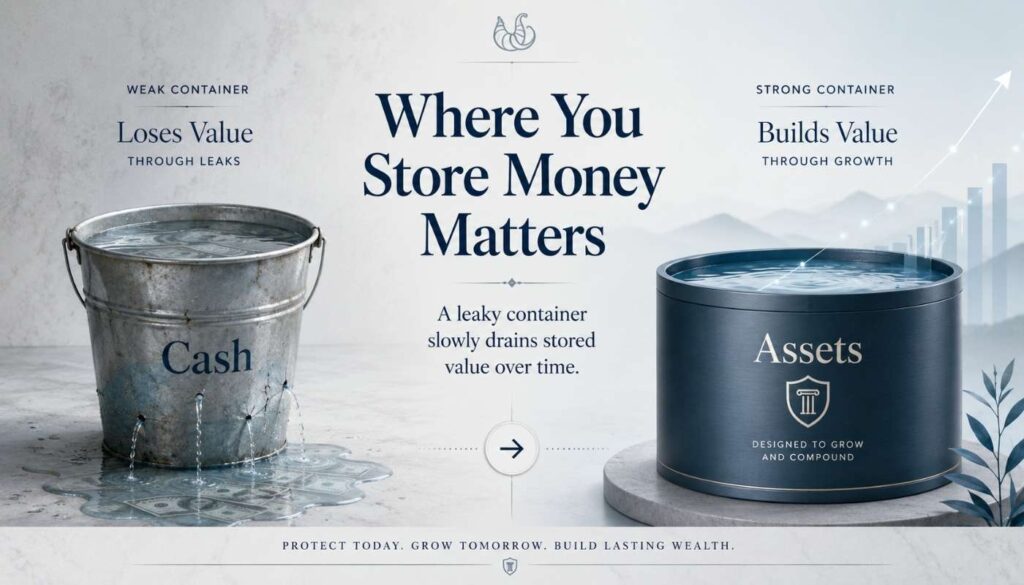
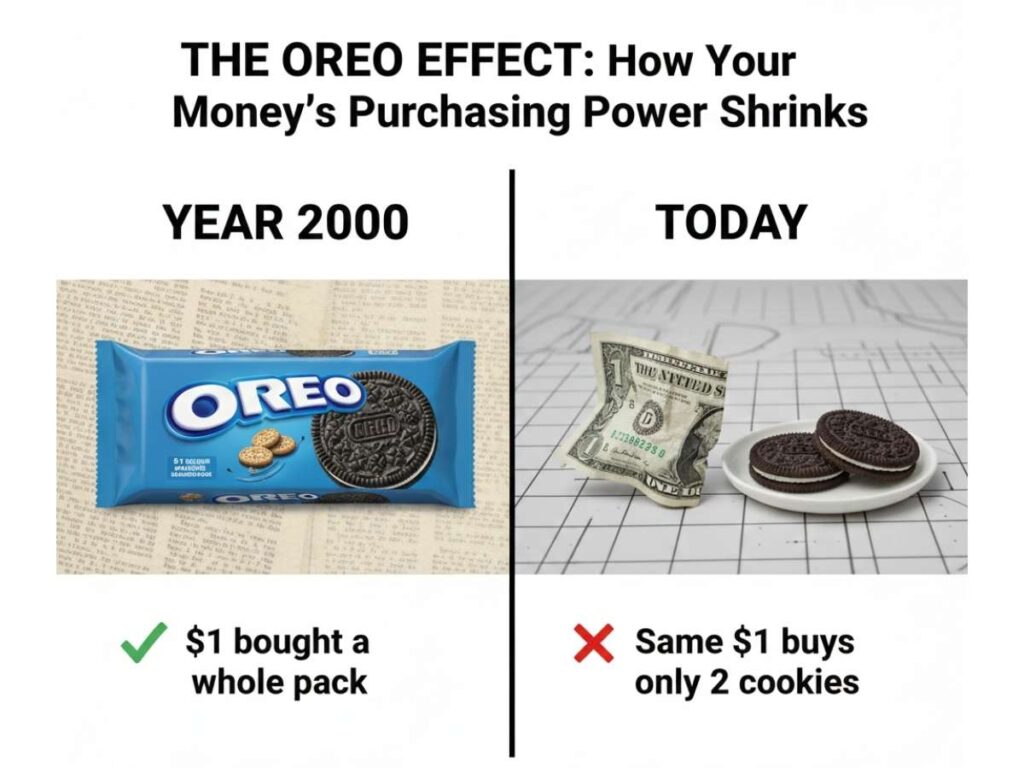
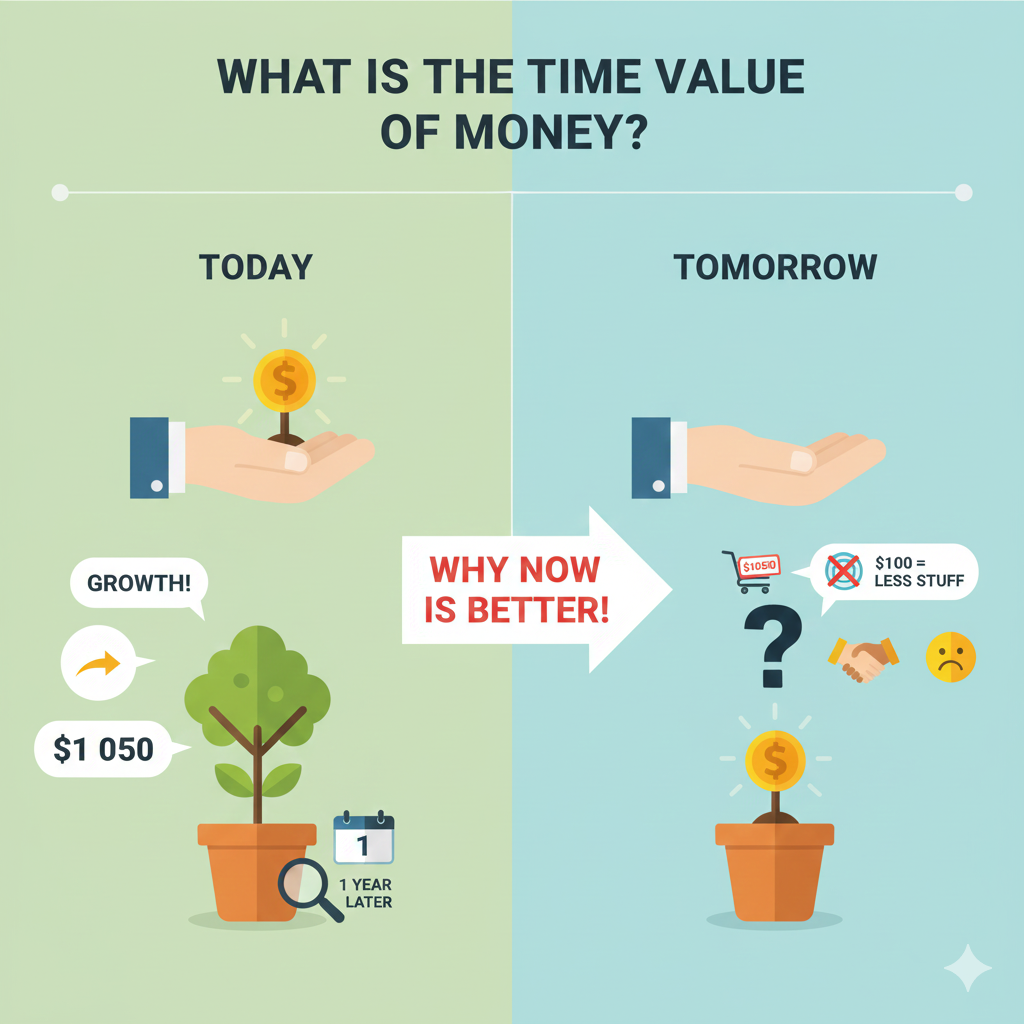
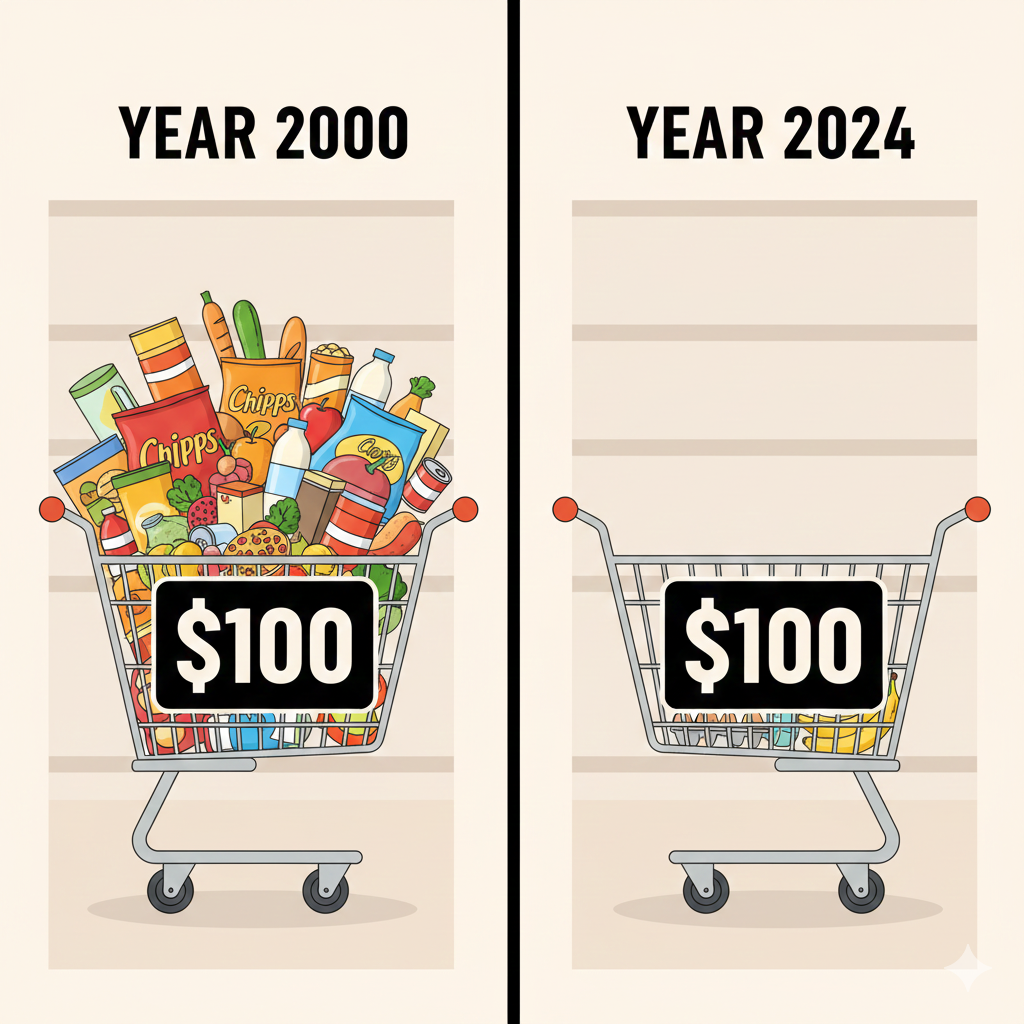
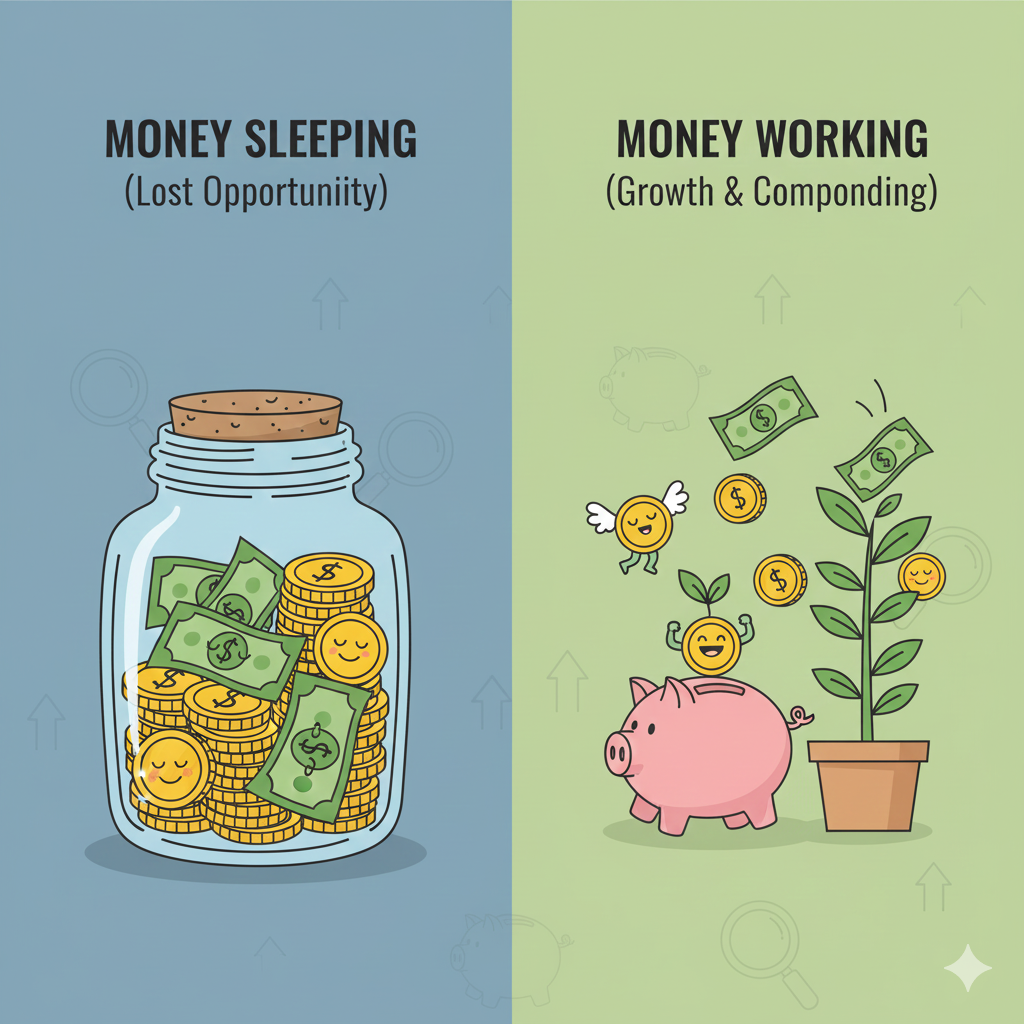
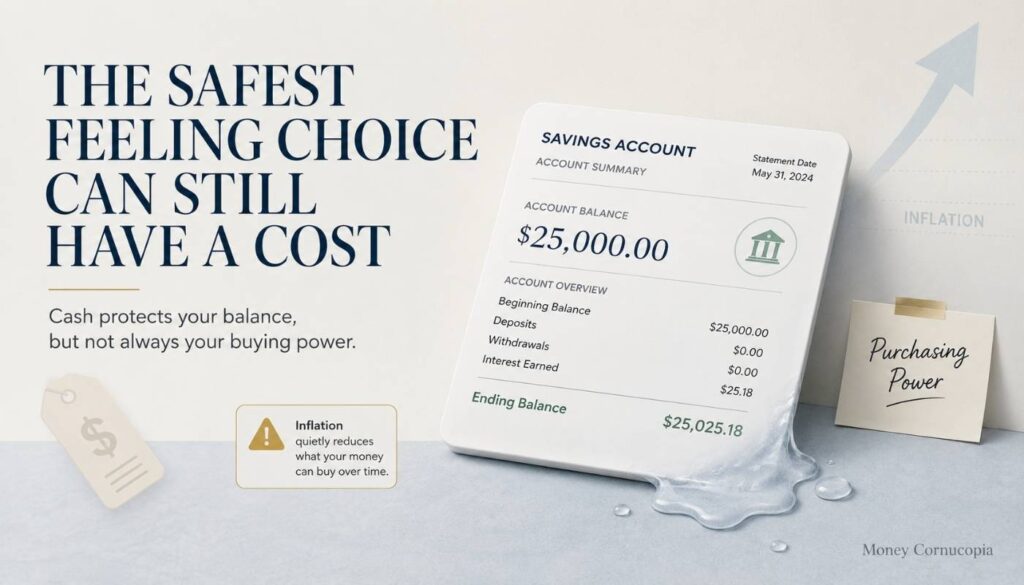
The bottom rung is cash and savings. Very sturdy. Almost no shaking. But you are barely off the ground. After inflation, your money might actually be losing purchasing power while sitting “safely” in your account.
The middle rung is bonds and fixed income. You are higher up now. You can see some growth. There is a slight breeze. You are lending money to a government or company in exchange for a steady interest payment.
The top rung is stocks and equity. The view is incredible. This is where real long-term wealth is built. But the ladder shakes when the wind blows. In a bad year, your portfolio can drop 20% to 30%. To enjoy the view at the top, you have to be comfortable with the shaking.
The tradeoff is the fundamental rule connecting all three rungs: you cannot get top-rung returns while standing on the bottom rung. The potential for growth and the potential for loss are physically linked. You cannot separate them.
How I Learned This the Hard Way (Twice)
The best way to understand the risk-return tradeoff is to get it wrong once.
How I Lost $1,000 on an Investment I Did Not Understand
A few years ago, my brother recommended an insurance-linked investment product. I did not fully understand how it worked, but he was confident, and I trusted his judgment. I put in roughly $1,000.
Over time, I realized the product had high fees, poor returns, and restrictive withdrawal terms. By the time I pulled out, I had lost most of my investment. The lesson was painful but simple: the risk was not in the investment itself. The risk was in investing in something I did not understand.
This is one of the most important nuances of the risk-return tradeoff that most guides miss. Risk is not just about market volatility. It includes the risk of not understanding what you own. A “safe” product with hidden fees can quietly destroy your money just as effectively as a stock market crash.
How My $1,000 Gold Purchase Became $2,500
In 2020, I walked into a jewelry shop and bought my wife gold earrings and a ring for a little over $1,000. My family had always viewed gold as a reliable store of value, and the timing felt right.
Six years later, that gold is worth roughly $2,500. A 150% return without opening a brokerage account, without checking stock tickers, without losing a minute of sleep.
I wrote about this in detail in my article on gold vs stocks vs savings, but the risk-return lesson is clear: gold was a moderate-risk choice that happened to pay off during a period of high inflation and global uncertainty. The same $1,000 left in a savings account would be worth roughly $1,125 today.
What My Insurance Loss and Gold Investment Taught Me About Risk
The insurance loss taught me that risk is not just about big market swings. It is about understanding what you are putting your money into.
The gold gain taught me that moderate, calculated risk with money you do not need immediately can produce real returns over time.
Together, they taught me that the risk-return tradeoff is not a theory you read about. It is something you live through with every financial decision you make.
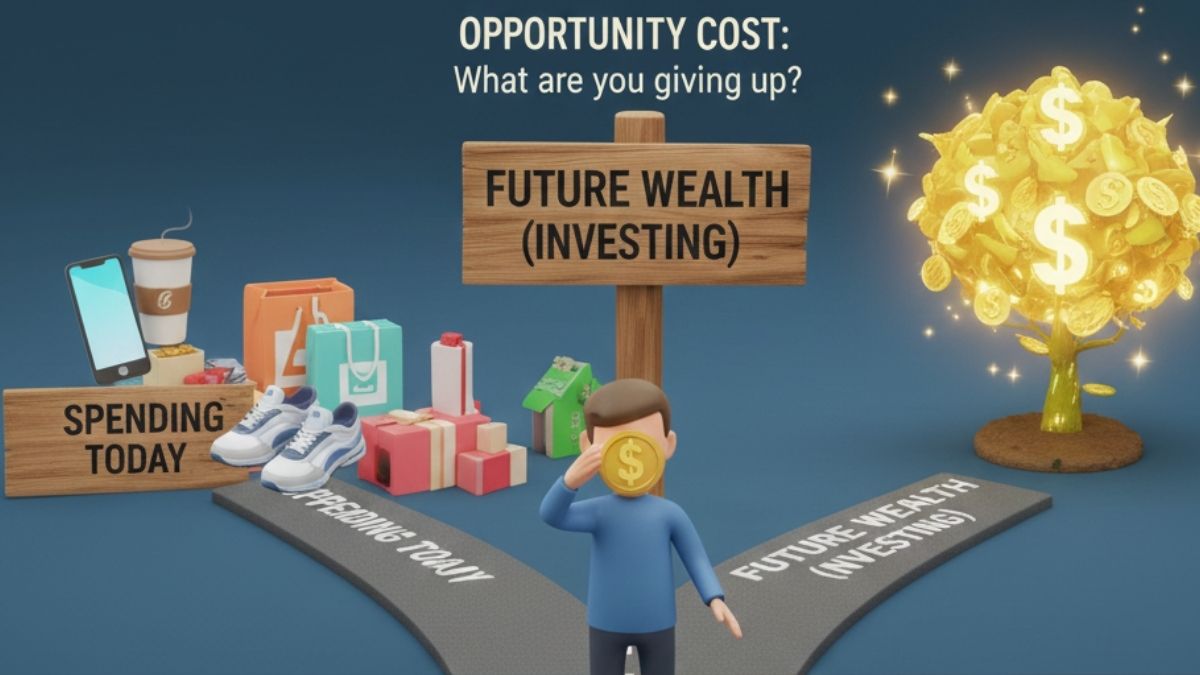
The Risk Return Tradeoff Shows Up Everywhere in Life
Most guides treat this concept as a stock market term. It is actually a life principle.
When I left my stable job to pursue a professional exam, I was making a risk-return tradeoff. I gave up a guaranteed salary for the possibility of a better career. The risk was real: I could not clear the exam. And I did not.
But stumbling into freelancing after that failure turned out to be one of the best financial decisions of my life. Freelancing gave me more control over my income and my time, and eventually led me to start my Etsy shop and this blog.
That entire journey, from stable job to failed exam to freelancing to building digital products, was a series of risk-return tradeoffs. Some paid off. Some did not. But the alternative, staying on the bottom rung forever out of fear, would have guaranteed one outcome: never growing.
The same logic applies to your money:
| Decision | The risk | The potential return |
|---|---|---|
| Starting an Etsy shop | $0.20 per listing — an extremely low financial risk | Passive income that compounds over time as products and reviews build up |
| Starting a blog | A few dollars a month for hosting — the main cost is time, not money | Long-term traffic, authority, and income that keeps growing without extra effort |
| Leaving money in savings | Feels safe but carries a hidden risk — inflation quietly erodes its value every year | Minimal growth, often below inflation — the “safe” choice can still cost you money |
How to Find Your Personal Risk Tolerance
The right amount of risk is the amount that lets you sleep at night.
Your risk tolerance is the level of potential loss you can handle without panicking and making emotional decisions. It depends on two factors.
Your Time Horizon
This is the most important variable.
If you have 10 or more years before you need the money, you can afford to take higher risks. Market crashes are temporary. History shows that stocks recover from every major crash within a few years. The longer your time horizon, the more shaking you can handle because you have time to wait for the ladder to stabilize.
If you need the money within 1 to 3 years, you should take lower risks. A market dip right before you need your money could force you to sell at a loss. Short-term horizons need stable investments.
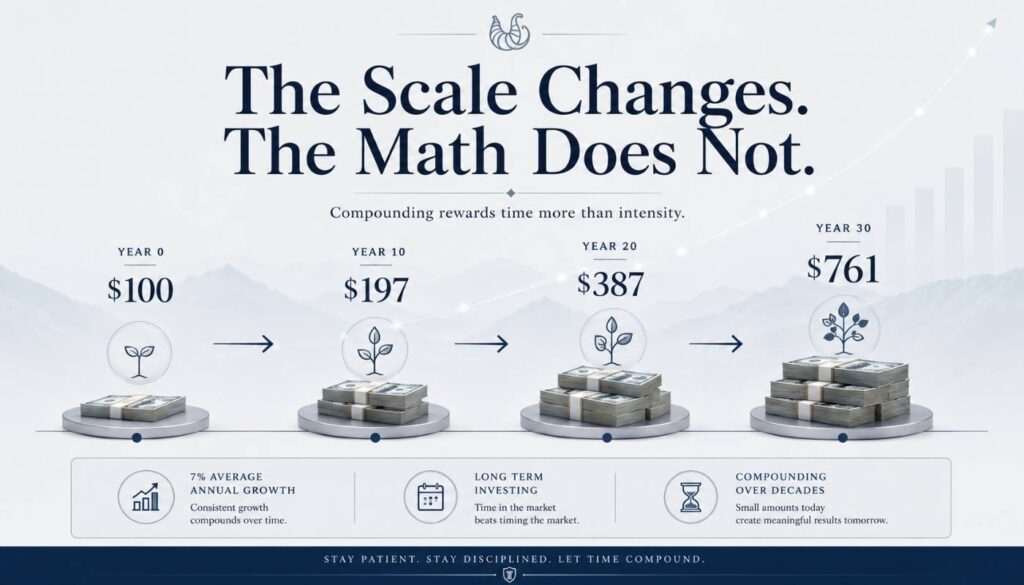
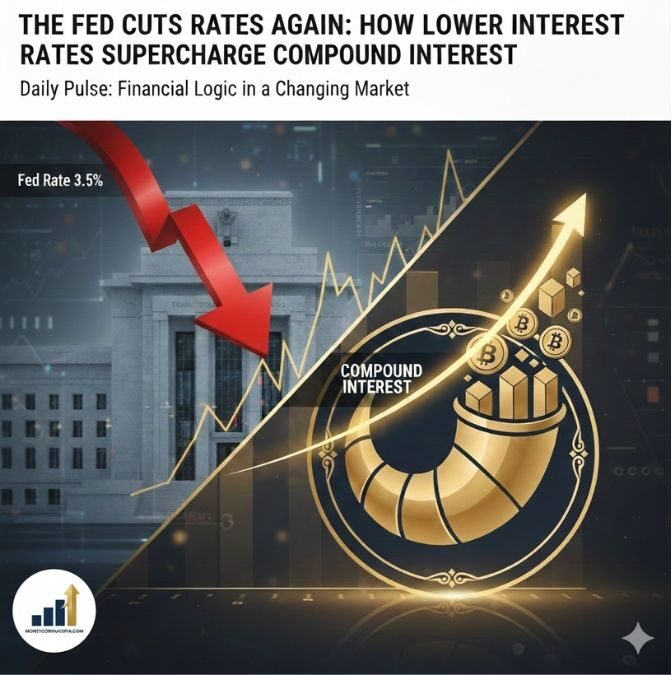
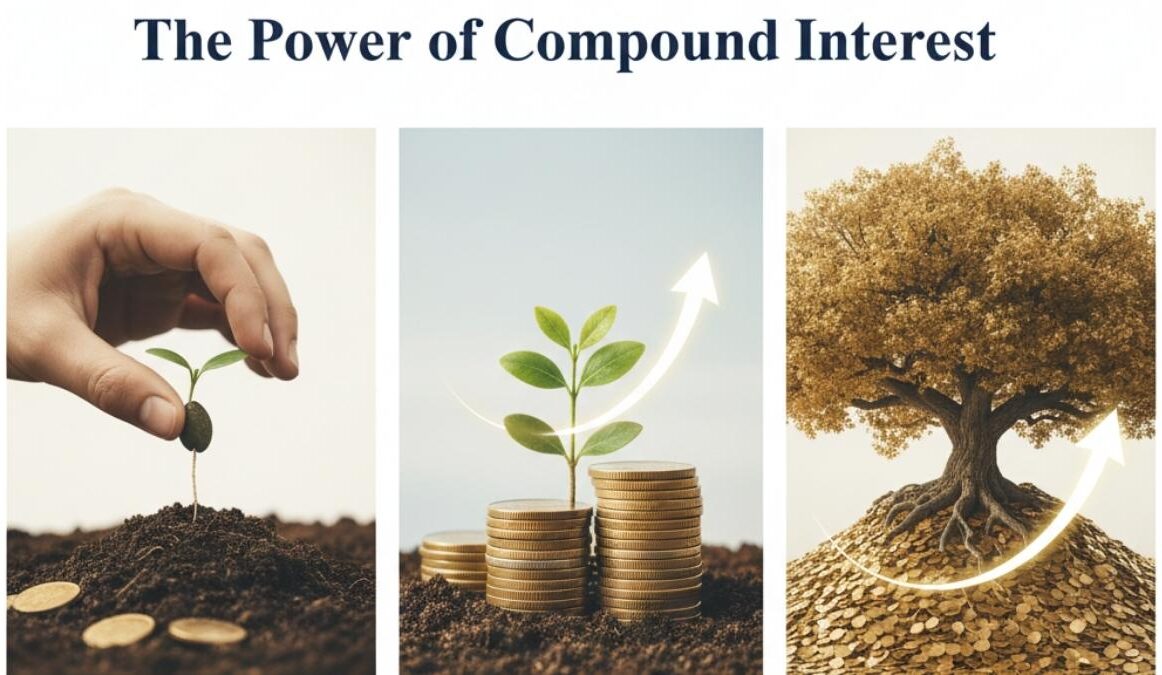
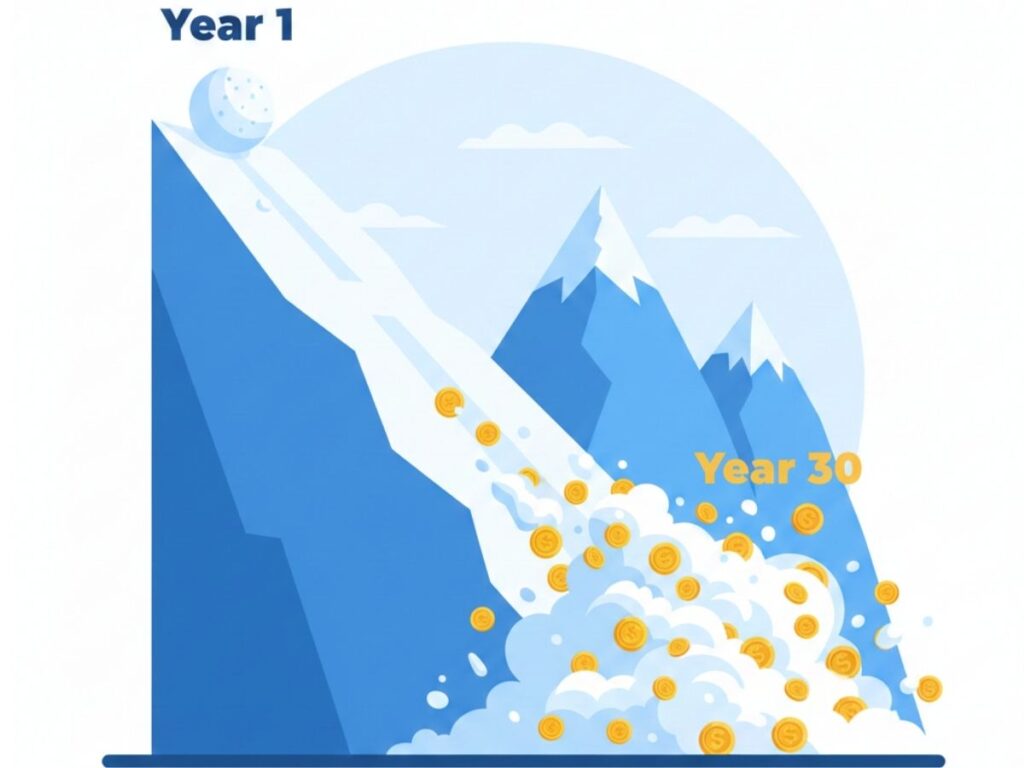
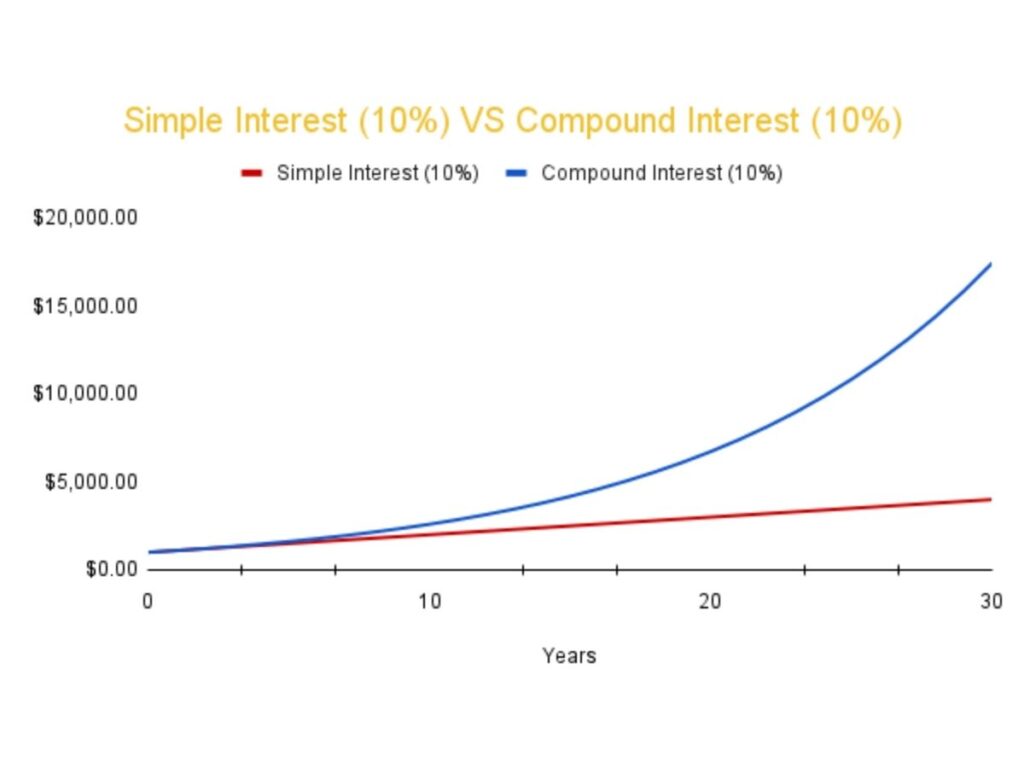
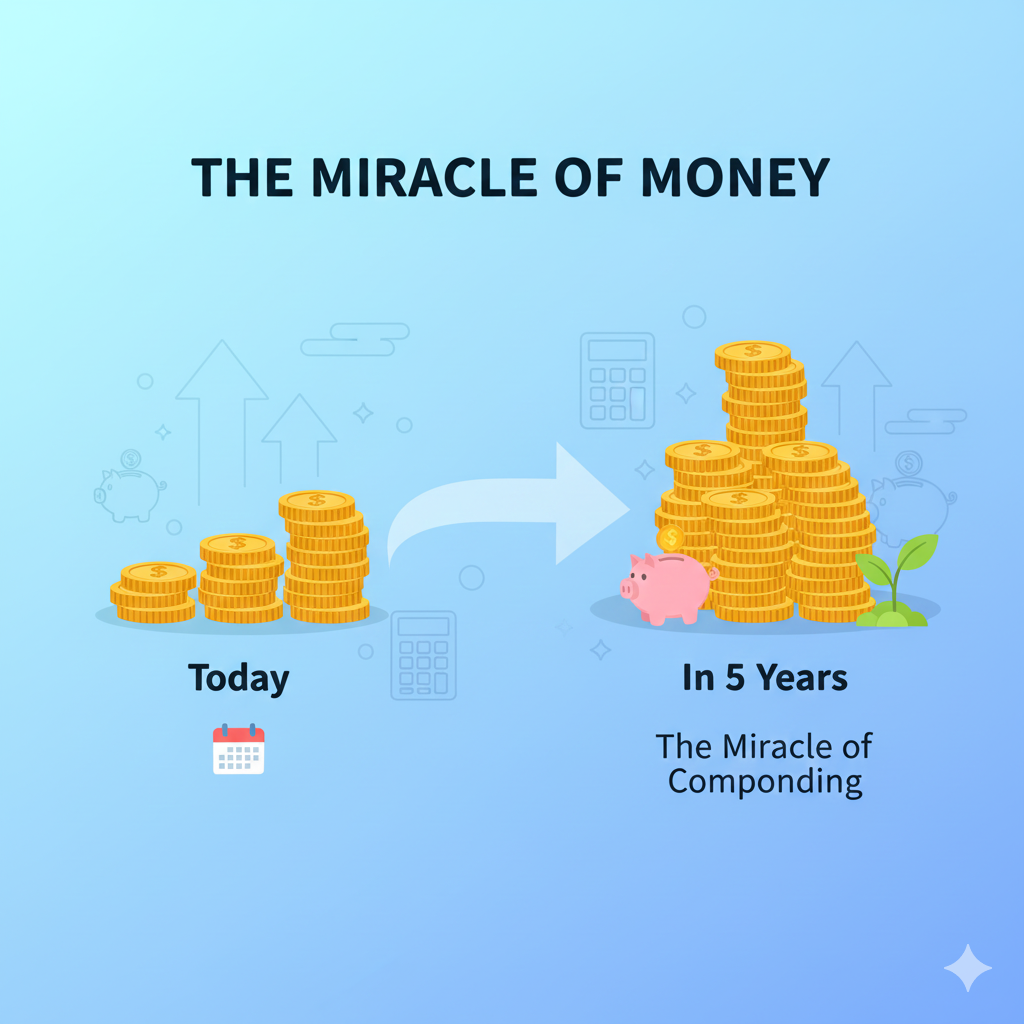
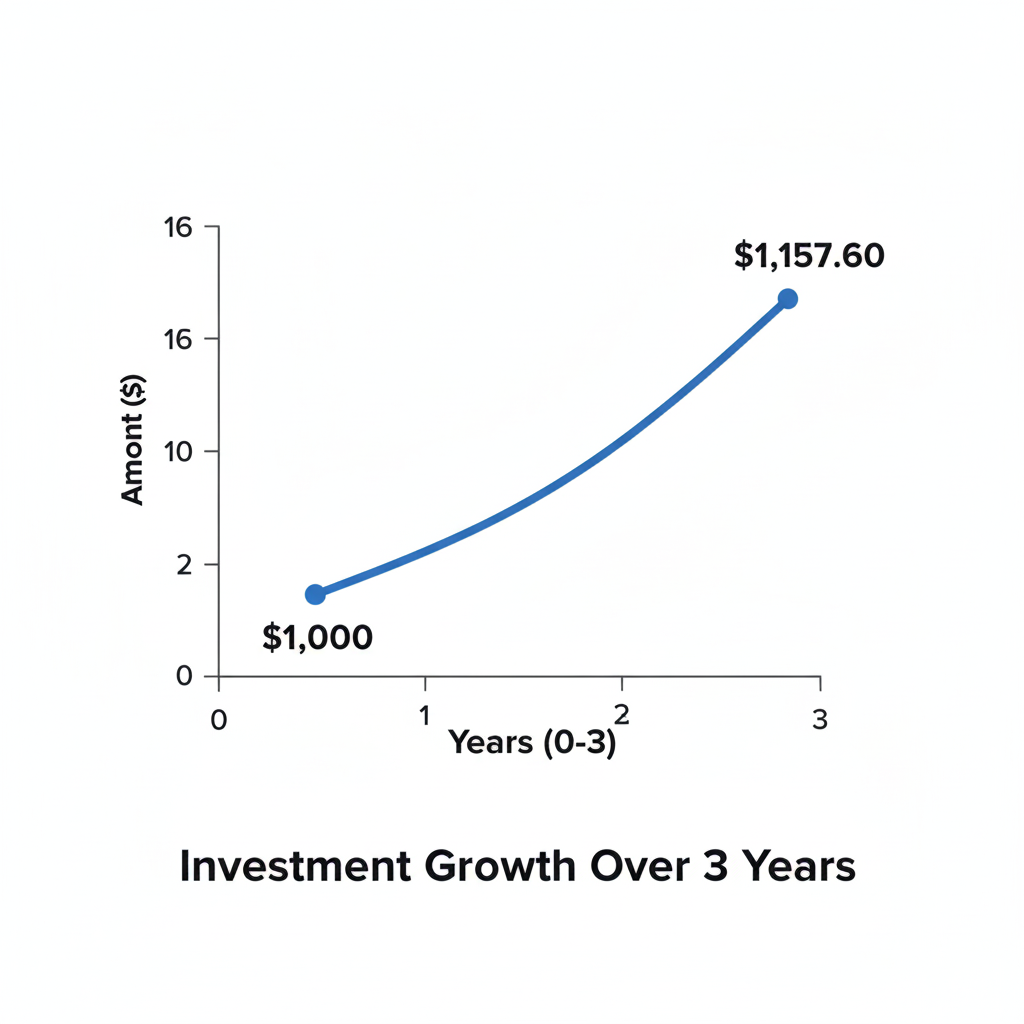
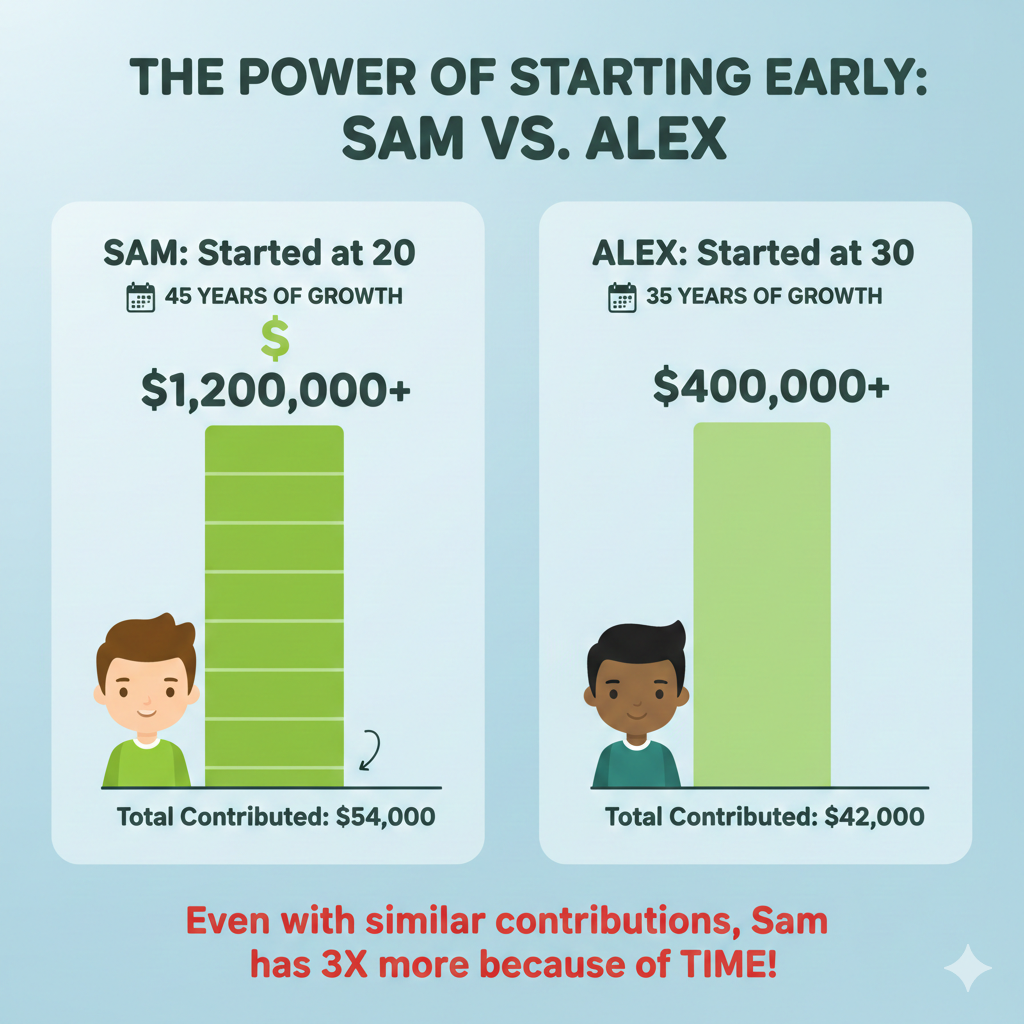
I wrote about how compound interest works over long periods, and the core lesson applies here: time is what turns risky investments into reliable ones.
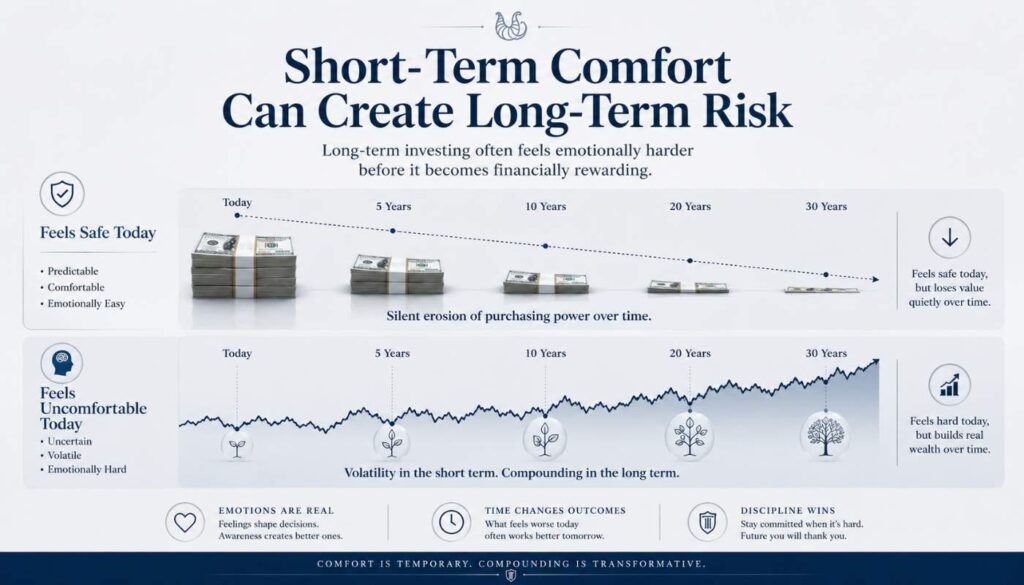
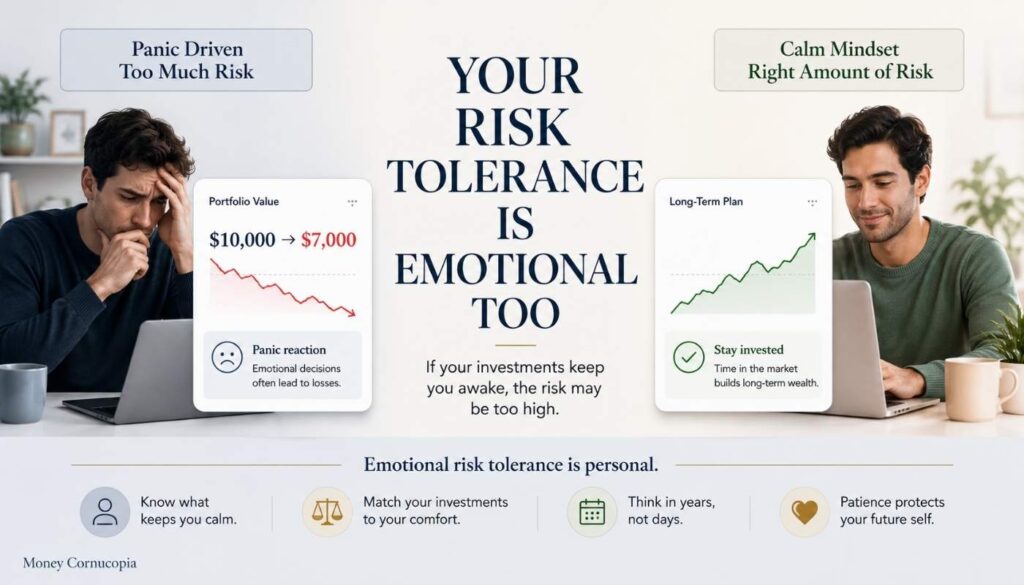
Your Emotional Tolerance
Imagine waking up tomorrow and seeing that your $10,000 investment is now worth $7,000. A 30% drop overnight.
If you think, “Stocks are on sale; I will buy more,” then you have high emotional tolerance for risk. If you feel sick and want to sell everything immediately, you have a lower tolerance. Both are valid. The wrong move is choosing a risk level that does not match your emotional reality, because you will panic sell at the worst possible moment.
This is the “sleep at night” test. If your investments keep you awake, you are taking too much risk regardless of what the math says.
What Different Risk Levels Actually Returned Since 2020
Theory is useful. Seeing actual returns is better.
Here is what $1,000 invested in 2020 became by May 2026 across different risk levels, based on real market data:
| Risk level | Investment | $1,000 became | Return | What it felt like |
|---|---|---|---|---|
| Low risk | Savings account (2% avg) | ~$1,125 | ~12.6% | Calm but barely grew |
| Low to moderate | Government bonds | ~$1,200 to ~$1,400 | ~20 to 40% | Steady and predictable |
| Moderate | Gold (physical) | ~$2,500 | ~150% | Smooth ride, pleasant surprise |
| High | S&P 500 stocks (with dividends) | ~$2,550 | ~155% | Volatile but rewarding |
| Very high | Individual tech stocks | Varies wildly | Could be +300% or -80% | Roller coaster |
These numbers are approximate and will vary depending on the exact dates, fees, taxes, exchange rates, interest rates, and the specific product used.
The pattern is clear. Higher risk levels generally produced higher returns over this 6-year period. But the gap between low risk (savings) and moderate risk (gold) was far larger than the gap between moderate risk (gold) and high risk (stocks).
This tells you something important: you do not need to take maximum risk to get meaningful returns. Moving from the bottom rung (savings) to the middle rung (gold, bonds, balanced funds) captures most of the benefit. Moving from the middle rung to the top rung adds more return but also significantly more volatility.
For most beginners, the middle of the ladder is the right place to start. That is where I started with my gold purchase, and it worked out well.
An Honest Note: Higher Risk Does Not Always Mean Higher Returns
Most guides skip this. I will not.
The risk-return tradeoff says higher risk offers higher potential returns. It does not guarantee them. My $1,000 insurance loss is proof of that. I took a risk. I got negative returns. The product was sold as “safe” but the fees and structure quietly destroyed value.
The same thing happens in the stock market. Individual stocks can go to zero. Speculative crypto tokens can collapse overnight. A high-risk investment in a poorly run company is not “high risk, high reward.” It is just high risk.
The tradeoff only works reliably when you:
The tradeoff only works reliably when you
| 1 | Understand what you are investing in — the insurance loss happened because I did not |
| 2 | Diversify across many investments so one failure does not wipe you out |
| 3 | Have a long enough time horizon for the math to work in your favor |
| 4 | Do not invest money you cannot afford to lose in high-risk options |
Risk without understanding is not investing. It is gambling.
A Beginner-Friendly Way to Think About Risk
If you are just starting out, here is how I would think about the risk-return tradeoff in practice.
| Your situation | Suggested approach | Why |
|---|---|---|
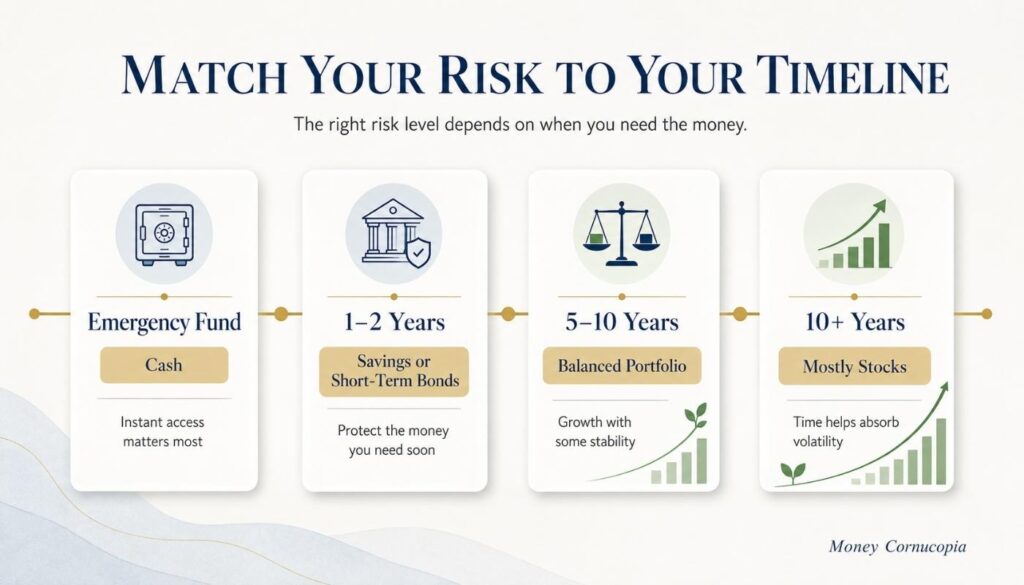
| Need the money within 1 to 2 years | Keep it in savings or short-term bonds | You cannot afford a market dip right before you need the money |
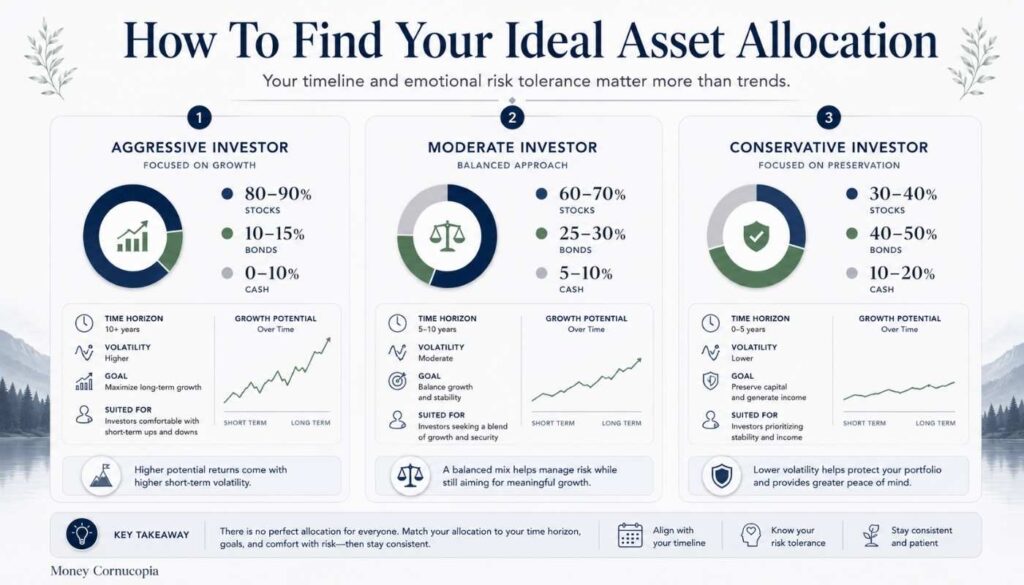
| Investing for 5 to 10 years | Mix of stocks and bonds — 60/40 or 70/30 | Enough time to ride out volatility, enough stability to sleep at night |
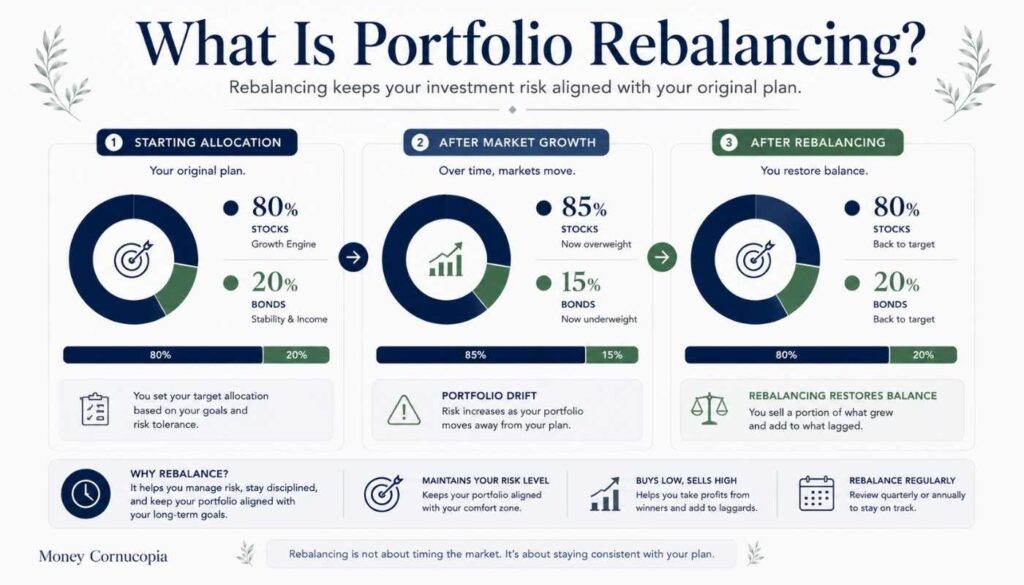
| Investing for 10 or more years | Mostly stocks with some bonds and gold — 80/10/10 | Time is on your side — compound interest does the heavy lifting |
| Emergency fund | Cash in a savings account | This money needs to be available instantly — not invested, not growing, just there |
You can start investing with as little as $100. The amount matters less than the allocation. Putting $100 into a balanced portfolio is better than leaving $10,000 in a savings account where inflation quietly eats it.
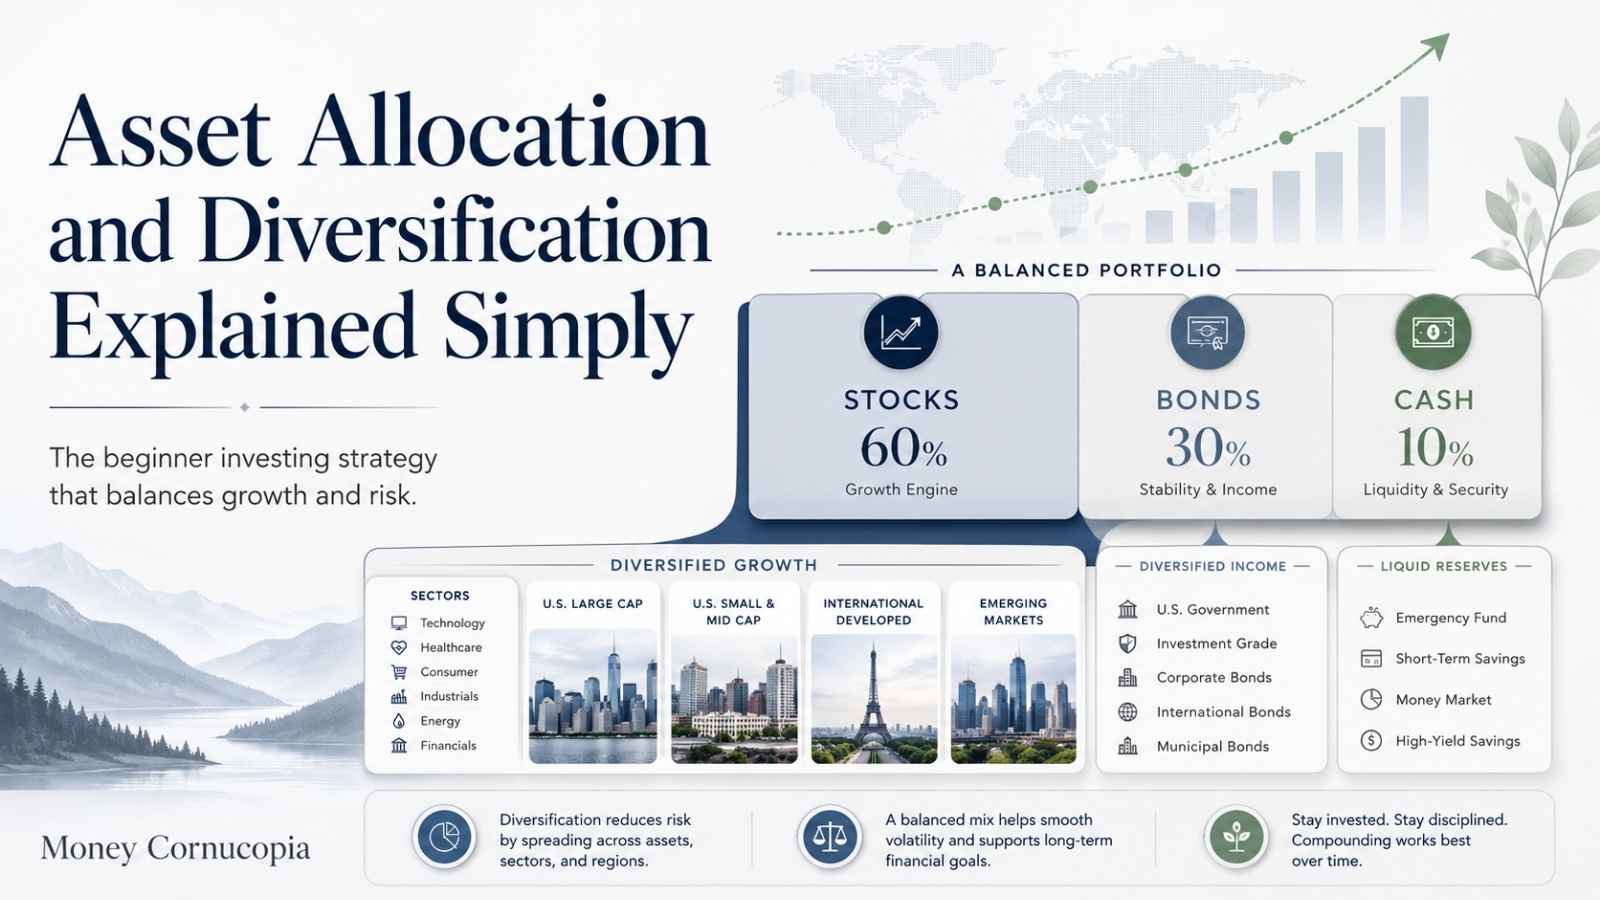
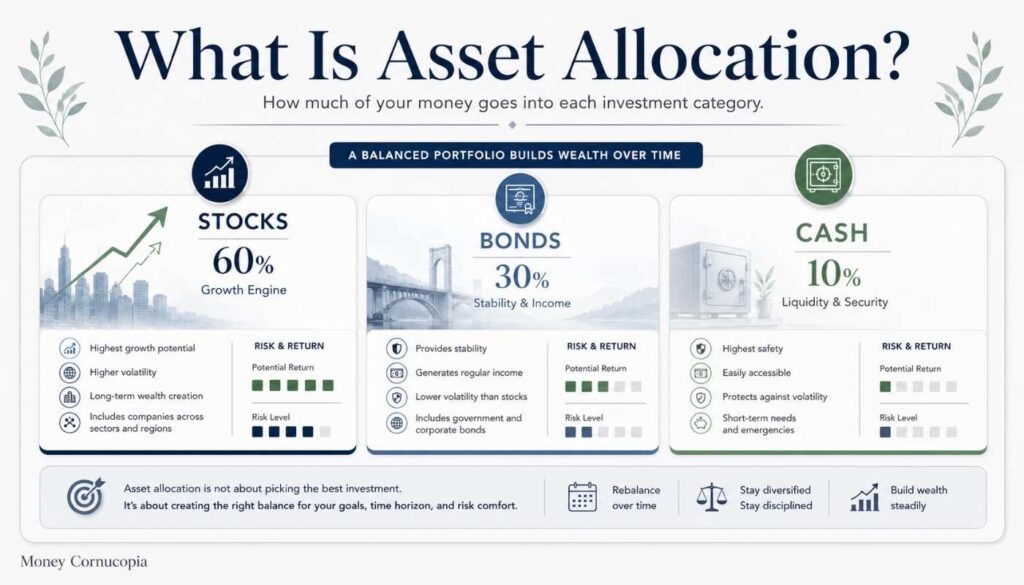
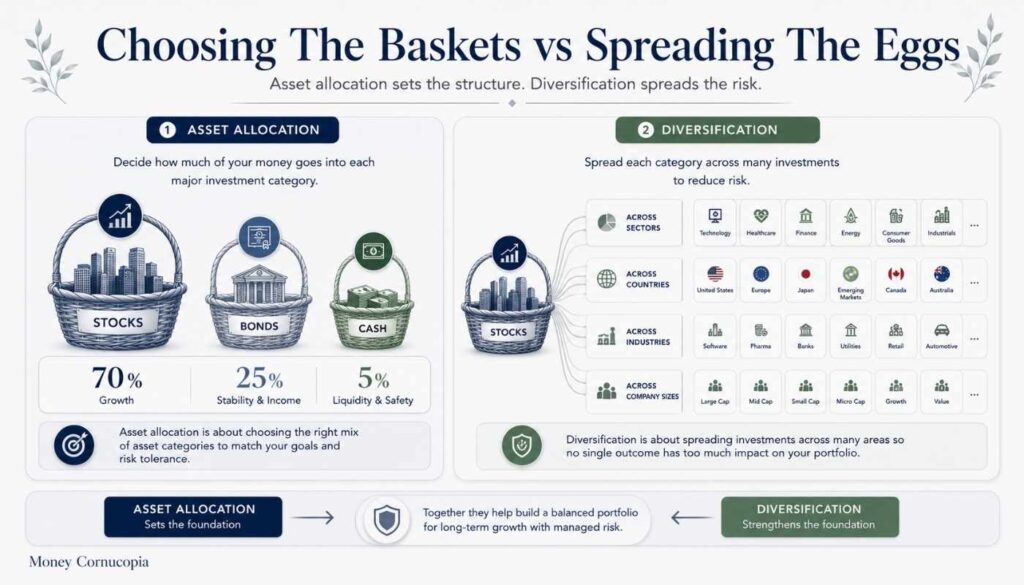
For a deeper look at how to split your money across different asset types, my guide on asset allocation and diversification walks through the exact framework I use.
And if you want to see the specific accounts and investments that sit at each rung of the risk ladder, from the safest savings options to higher-growth assets, I ranked the best compound interest accounts for beginners by exactly this risk level.
Frequently Asked Questions
What is the risk-return tradeoff in simple terms?
The risk-return tradeoff means that investments with higher potential returns generally come with a higher risk of losing money. Safer investments offer lower returns. Every financial decision involves choosing where you sit on this spectrum based on your goals, time horizon, and comfort level with uncertainty.
Is higher risk always better for higher returns?
No. Higher risk offers higher potential returns, but it does not guarantee them. A poorly chosen high-risk investment can lose everything. The tradeoff works reliably only when you understand what you are investing in, diversify your holdings, and have a long enough time horizon for the math to work.
What is risk tolerance, and how do I find mine?
Risk tolerance is how much potential loss you can handle without panicking and making emotional decisions. It depends on your time horizon (how long before you need the money) and your emotional comfort with seeing your investments drop in value. The “sleep at night” test is simple: if your investments keep you awake, you are taking too much risk.
Can I invest without taking any risk?
Almost no investment is truly risk-free. Even cash in a savings account carries inflation risk, meaning your money buys less over time as prices rise. Government-insured savings accounts protect your principal, but they do not protect your purchasing power. Some level of risk is necessary to grow your money in real terms.
How does my age affect how much risk I should take?
Younger investors with decades before retirement can generally take more risk because they have time to recover from market downturns. As you get closer to needing your money, reducing risk protects your capital from short-term drops. A common guideline is to hold a higher percentage of stocks when young and gradually shift toward bonds and cash as you age.
What is the difference between risk and volatility?
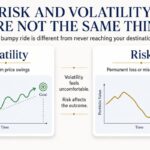
Risk is the chance of permanently losing money or failing to meet your financial goals. Volatility is how much an investment’s price swings up and down over short periods. A volatile investment is not necessarily risky if you have a long time horizon, because short-term price swings tend to smooth out over years and decades.
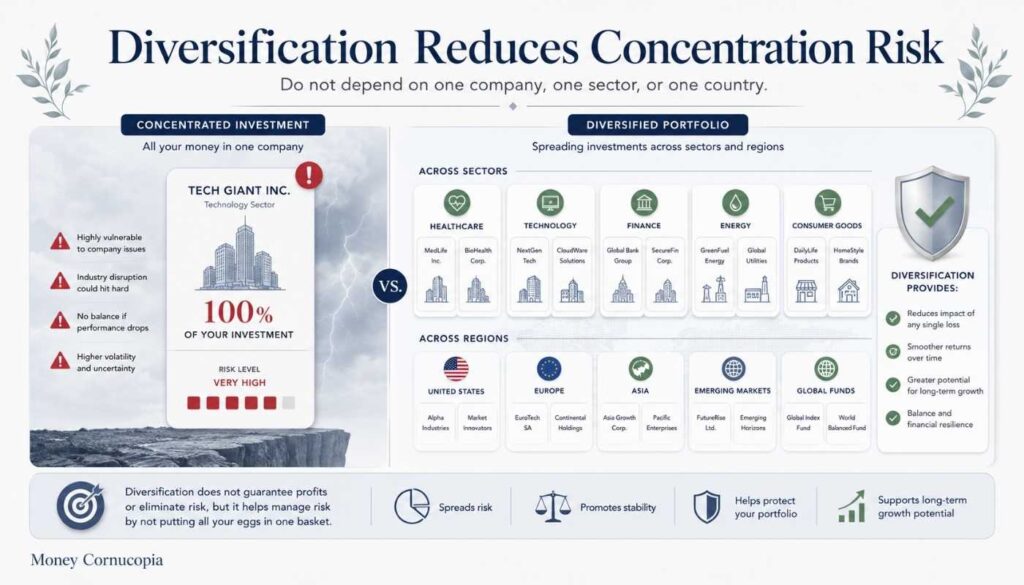
How does diversification reduce risk?
Diversification spreads your money across different types of investments so that one poor performer does not destroy your entire portfolio. If you own stocks in 500 companies across multiple industries and countries, one company failing barely affects your total. Diversification reduces the impact of individual failures without necessarily reducing your overall returns.
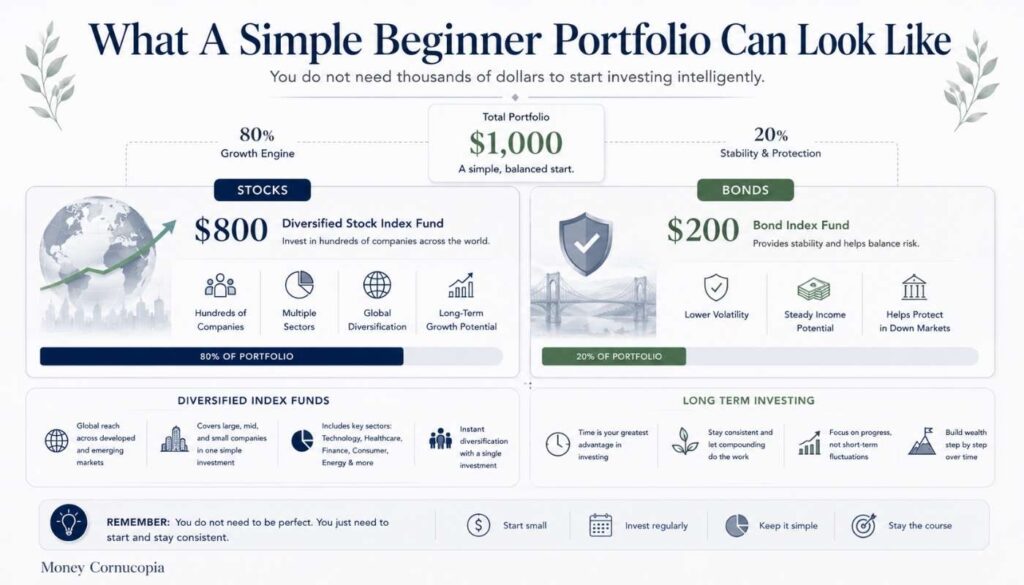
What is the safest way to start investing as a beginner?
Start with a low-cost, diversified index fund that holds hundreds of stocks in one purchase. This gives you broad market exposure with built-in diversification. Pair it with a small bond allocation for stability. Keep your emergency fund in cash. And most importantly, only invest money you will not need for at least 5 years, so you have time to ride out volatility.
Final Thoughts
The risk-return tradeoff is not just a concept you read about in a finance textbook. It is something you live through with every decision you make about your money, your career, and your time.
I have been on both sides. I lost $1,000 on an insurance product I did not understand because I took a risk without doing the research. I doubled $1,000 in gold because I took a calculated risk based on family wisdom and reasonable timing. I left a stable job, failed an exam, stumbled into freelancing, and ended up building something I am genuinely proud of.
Every one of those was a risk-return tradeoff. Some worked out. Some did not. But the one decision that would have guaranteed the worst outcome was never taking any risk at all.
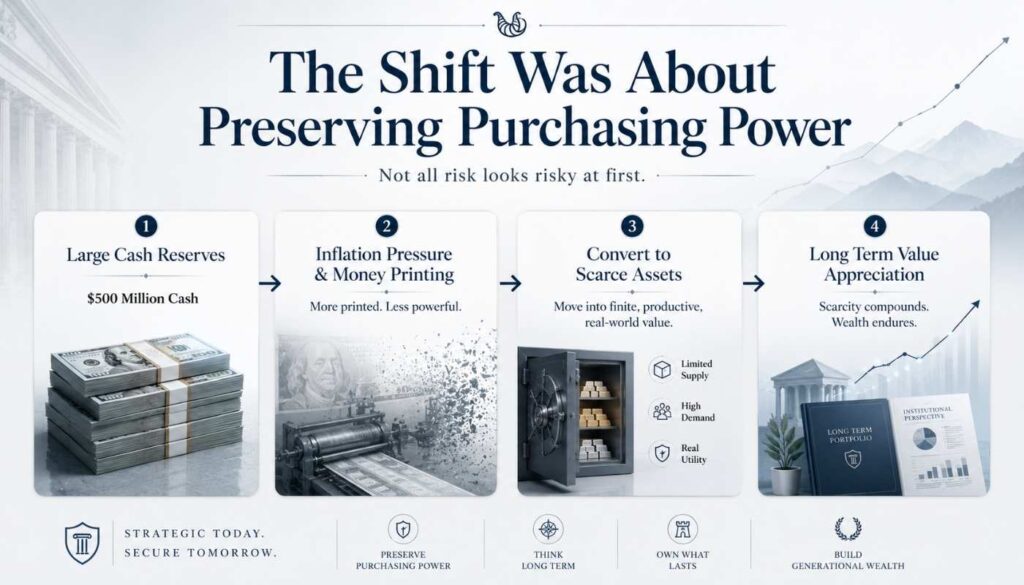
Long-term cash can become a melting ice cube when inflation stays above the interest you earn. The safest feeling option is often the one that quietly costs you the most.
Find your rung on the ladder. Make sure you understand what you are investing in. Give yourself enough time for the math to work. And choose a level of risk that lets you sleep at night.
That is the whole tradeoff. And once you understand it, every other financial concept becomes easier to navigate.